LLVM source-based code coverage
rustc supports detailed source-based code and test coverage analysis
with a command line option (-C instrument-coverage) that instruments Rust
libraries and binaries with additional instructions and data, at compile time.
The coverage instrumentation injects calls to the LLVM intrinsic instruction
llvm.instrprof.increment at code branches
(based on a MIR-based control flow analysis), and LLVM converts these to
instructions that increment static counters, when executed.
The LLVM coverage instrumentation also requires a Coverage Map that encodes source metadata,
mapping counter IDs–directly and indirectly–to the file locations (with
start and end line and column).
Rust libraries, with or without coverage instrumentation, can be linked into instrumented binaries.
When the program is executed and cleanly terminates,
LLVM libraries write the final counter values to a file (default.profraw or
a custom file set through environment variable LLVM_PROFILE_FILE).
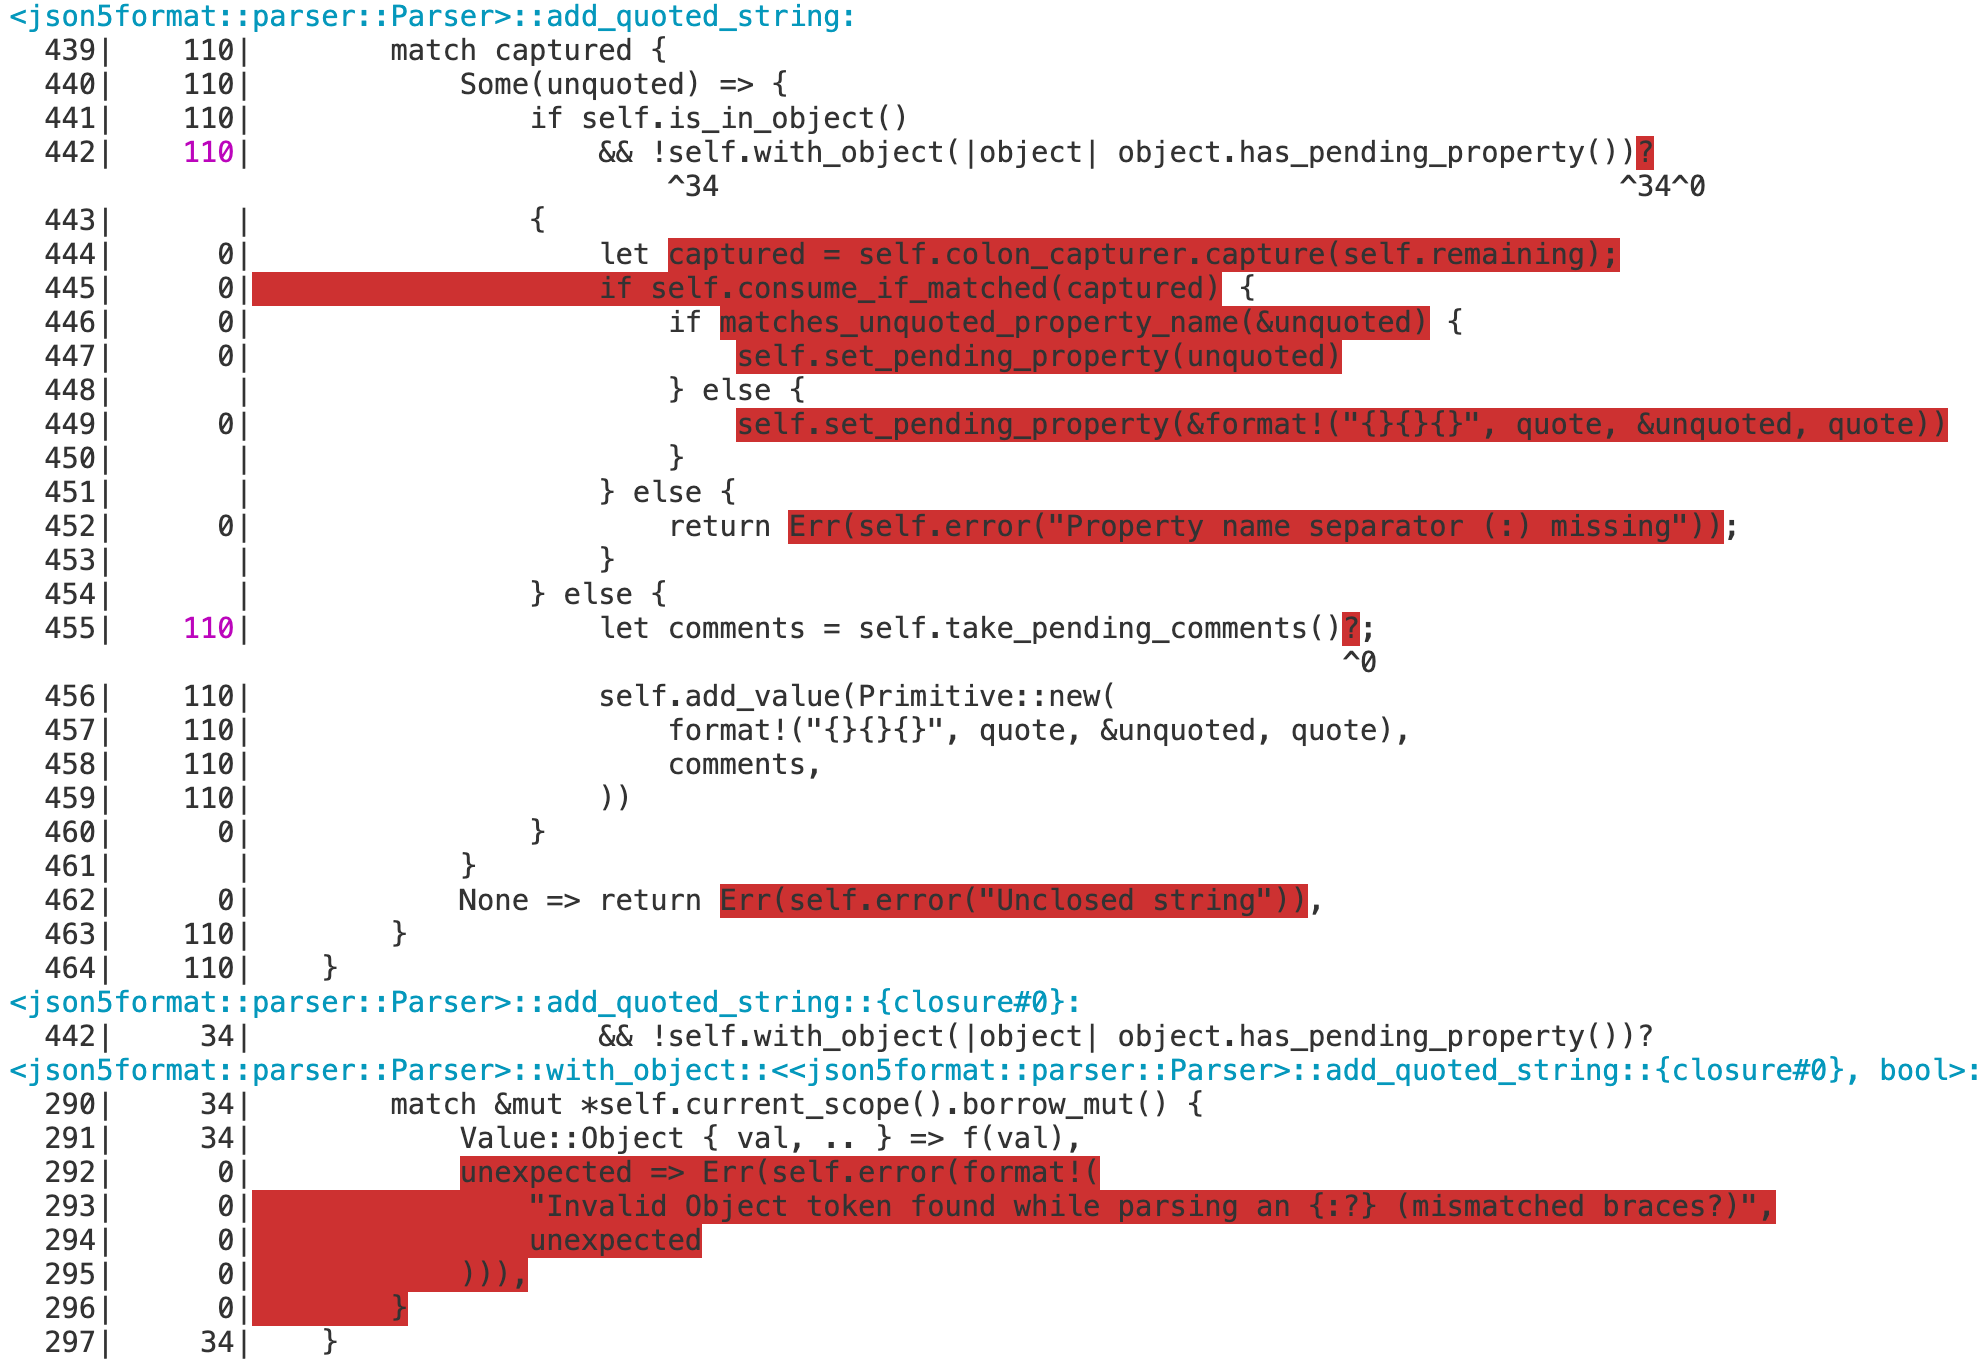
Developers use existing LLVM coverage analysis tools to decode .profraw
files, with corresponding Coverage Maps (from matching binaries that produced
them), and generate various reports for analysis, for example:
Detailed instructions and examples are documented in the rustc book.
Recommended bootstrap.toml settings
When working on the coverage instrumentation code, it is usually necessary to
enable the profiler runtime by setting profiler = true in [build].
This allows the compiler to produce instrumented binaries, and makes it possible
to run the full coverage test suite.
Enabling debug assertions in the compiler and in LLVM is recommended, but not mandatory.
# Similar to the "compiler" profile, but also enables debug assertions in LLVM.
# These assertions can detect malformed coverage mappings in some cases.
profile = "codegen"

# IMPORTANT: This tells the build system to build the LLVM profiler runtime.
# Without it, the compiler can't produce coverage-instrumented binaries,
# and many of the coverage tests will be skipped.
build.profiler = true

# Enable debug assertions in the compiler.
rust.debug-assertions = true
Rust symbol mangling
-C instrument-coverage automatically enables Rust symbol mangling v0 (as
if the user specified -C symbol-mangling-version=v0 option when invoking
rustc) to ensure consistent and reversible name mangling.
This has two important benefits:
- LLVM coverage tools can analyze coverage over multiple runs, including some changes to source code; so mangled names must be consistent across compilations.
- LLVM coverage reports can report coverage by function, and even separates out the coverage counts of each unique instantiation of a generic function, if invoked with multiple type substitution variations.
The LLVM profiler runtime
Coverage data is only generated by running the executable Rust program.
rustc statically links coverage-instrumented binaries with LLVM runtime code
(compiler-rt) that implements program hooks
(such as an exit hook) to write the counter values to the .profraw file.
In the rustc source tree,
library/profiler_builtins bundles the LLVM compiler-rt code into a Rust library crate.
Note that when building rustc,
profiler_builtins is only included when build.profiler = true is set in bootstrap.toml.
When compiling with -C instrument-coverage,
CStore::postprocess() dynamically loads
profiler_builtins by calling inject_profiler_runtime().
Testing coverage instrumentation
(See also the compiletest documentation for the tests/coverage
test suite.)
Coverage instrumentation in the MIR is validated by a mir-opt test:
tests/mir-opt/coverage/instrument_coverage.rs.
Coverage instrumentation in LLVM IR is validated by the tests/coverage
test suite in coverage-map mode.
These tests compile a test program to LLVM IR assembly, and then
use the src/tools/coverage-dump tool to extract and pretty-print the
coverage mappings that would be embedded in the final binary.
End-to-end testing of coverage instrumentation and coverage reporting is
performed by the tests/coverage test suite in coverage-run mode,
and by the tests/coverage-run-rustdoc test suite.
These tests compile and run a test program with coverage
instrumentation, then use LLVM tools to convert the coverage data into a
human-readable coverage report.
Tests in
coverage-runmode have an implicit//@ needs-profiler-runtimedirective, so they will be skipped if the profiler runtime has not been enabled inbootstrap.toml.
Finally, the tests/codegen-llvm/instrument-coverage/testprog.rs test compiles a simple Rust program
with -C instrument-coverage and compares the compiled program’s LLVM IR to
expected LLVM IR instructions and structured data for a coverage-enabled
program, including various checks for Coverage Map-related metadata and the LLVM
intrinsic calls to increment the runtime counters.
Expected results for the coverage, coverage-run-rustdoc,
and mir-opt tests can be refreshed by running:
./x test coverage --bless
./x test coverage-run-rustdoc --bless
./x test tests/mir-opt --bless